![]() for Healthcare DataScience
for Healthcare DataScience
Trends in Maternal Mortality in Nigeria: Impact of the MDG
May 1, 2017
Introduction
Maternal Mortality Ratio (MMR) is the number of deaths of mothers directly related to their pregnancy state or aggravated by it occuring in a particular community/country per 100 000 live births in the same community/country in a given year. It does not include near death experiences and several other morbidities that could happen before, during or after delivery. It is a painful thing that a woman should lose her life in the process of birthing another hence the need to ensure that preventable and avoidable causes are brought to the barest minimum (if not totally eliminated).
This article uses data from the WorldBank Development Indicator and the World Population Prospects 2015 databases to analyse the trend in maternal mortality from 1990 to 2015. The Millenium Development Goal(MDG) 5A focused on reducing by three-quarters the 1990 MMR by the year 2015.
Maternal Mortality Ratio
Global overview
At the turn of the century, Sierra Leone had the highest MMR (2650). After the MDGs, the same country still had the highest MMR but this value has reduced drastically to 1360. The top 20 countries with the highest MMR before and after the MDGs are shown in fig. 1 and 2.
year 2000
fig. 1: countries with the highest MMR in 2000
year 2015
fig.2: countries with the higest MMR in 2015
Nigeria
Prior to the MDGs, there has been a steady decline in MMR globally, partly because of improved maternal healthcare, literacy and global peace. Yet the MDG was able to significantly cause further reduction in MMR (p-value of 0.02801). However, same cannot be said about Nigeria. The MDG does not appear to have significantly reduce the MMR (table 1). Could this mean that MDG failed in the country?
| before_mdg | after_mdg | statistic | p.value |
|---|---|---|---|
| 1.444 | 2.501333 | -1.175463 | 0.1285047 |
Taking a closer look at the MMR trend in Nigeria, it will not be so surprising as to why the situation is as it is (fig. 3). There was a rapid decline in MMR in the early MDG years up to 2008 where a sharp upturn could be seen, then sluggish decline afterwards. This period of sharp upturn and sluggish decline coincides with the peak periods of the Boko Haram crisis in the Northern part of the country and the MEND (Movement for the Emancipation of the Niger-Delta) in the south.
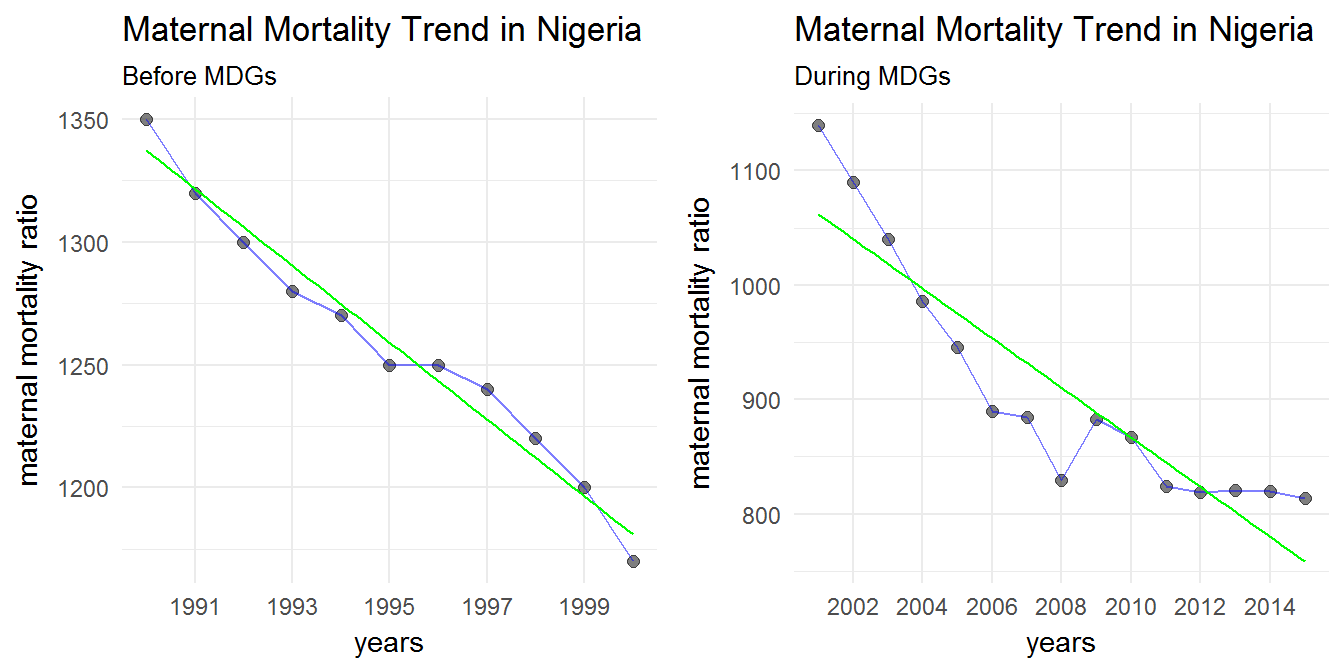
fig. 3: trend in mmr in Nigeria before and after mdg
Maternal Deaths
Introduction
Maternal death is defined as “the death of a woman while pregnant or within 42 days of termination of pregnancy, irrespective of the duration and site of pregnancy, from any cause related to or aggravated by pregnancy, but not from accidental or incidental causes”. Giving that the number of maternal death mirrors the country population of women, one might expect countries with very large population to be responsible for most of the maternal deaths. The reality however is far from this. In the year 2000, India accounted (by far) for the majority of maternal deaths. This changed at the end of the MDG, being able to close the huge gap and losing the position to Nigeria (figs 4 and 5).
Year 2000
fig. 4: countries with the highest maternal deaths in 2000
Year 2015
fig.5: countries with the highest maternal deaths in 2015
Nigeria
Like MMR, maternal deaths steadily declined from 532,000 in 1990 to 441,000 in 2000, and further to 302,000 in 2015 (the all time lowest). Giving that the population of women also increased by 40.52% during the same period, this is a huge achievement thanks to the MDG who contributed the majority (p-value of 0.01895).
Nigeria however has steadily contributed more to maternal deaths (tables 2 and 3).
| year | Globe | Nigeria | contribution(%) |
|---|---|---|---|
| 1990 | 532000 | 57000 | 10.71 |
| 2000 | 441000 | 62000 | 14.06 |
| 2015 | 302000 | 58000 | 19.21 |
| year | Africa | Nigeria | contribution |
|---|---|---|---|
| 1990 | 230000 | 57000 | 24.78 |
| 2000 | 240000 | 62000 | 25.83 |
| 2015 | 203000 | 58000 | 28.57 |
At first, one might try to explain this given the large population of Nigeria and its population growth rate. However, comparing Nigeria with India (another developing country with a population size almost 10 times that of Nigeria and also with a steady population growth rate), it becomes obvious that other reasons are responsible for this (fig. 6).1
fig. 6: trends in maternal deaths in Nigeria and India
The last plot (fig. 7) is an interactive and animated graph which says far more than can be expressed with words. The more you study it, the more information it brings to limelight. Three countries are particularly of interest:2
- Sierra Leone (the blue point with highest Maternal Morality Ratio)
- Nigeria (the blue point on the extreme right)
- India: the large brown point on the extreme right.
fig. 7: animated graph of global maternal mortality trends
Conclusion
The Maternal Mortality Ratio in Nigeria has steadily declined over the past 25 years. Same cannot be said of the Maternal Deaths. These values are still unacceptably high and drastic measures need to be taken to ensure this. The MDG 5A does not appear to have been successful in Nigeria. This is not unexpected giving the level of civil and political unrests experienced in the country over the last 10 years.
In Africa, 4 countries have MMR less than 100 (already achieved the SDG target!!). These countries all seem to have enjoyed long peaceful years and stable economy. This further shows the influence of a peace in promoting maternal health.
| country | mmr |
|---|---|
| Libya | 9 |
| Egypt, Arab Rep. | 33 |
| Mauritius | 53 |
| Tunisia | 62 |
| Nigeria | 814 |
To achieve the SDG goal of a MMR less than 70 by 2030, Nigeria needs an annual decline of 49.6 in MMR (compared to annual decline of 21.7 during the MDG-years). A decline more than two times that of the MDG. Therefore, strong and sustained efforts need to be put in place and a sincere desire for peaceful co-existence needs to exist in all. Early and continuous data collection and analysis should also be instituted to allow for prompt evaluation and adaptation of plans to keep us on track to achieve the desired goal.
the red points indicate years where the population of women of reproductive age is also included↩
continents can be activated and deactivated by clicking on them from the legend as necessary. To replay the animation, we recommend that you first drag the animation cursor to “1990” then press “play”.↩